Label : droughtTRMMprecipitationBelt and Roadcropland
Date: 2017-09-28
View counts: 12525
Browse document: Browse document
Download Dataset: Log in
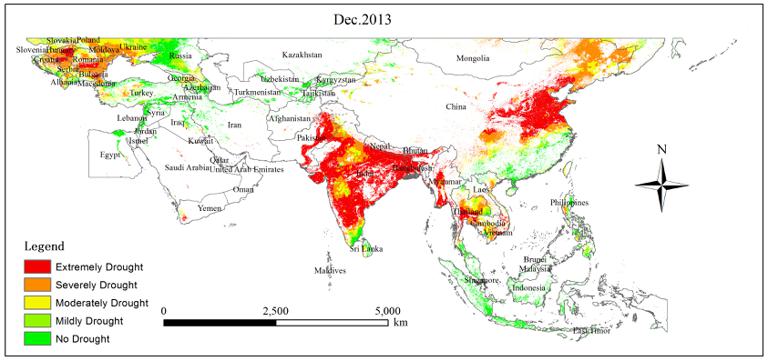
Based on the Tropical Rainfall Measurement Satellite (TRMM) 3B43 precipitation data, we used the Precipitation Abnormity Percentage drought model to study the monthly spatio-temporal distribution of drought in south region of N50° of OBOR area from 2001 to 2013. Yearly spatio-temporal distribution from 2001 to 2013 of cropland in OBOR area was extracted based on the MODIS MCD12Q1 dataset and there were 156 monthly drought levels in the cropland region according to the overlaying of drought and agricultural land layers. The data are in TIFF format with a spatial resolution of 500 m.
Comment list ( 0 )

