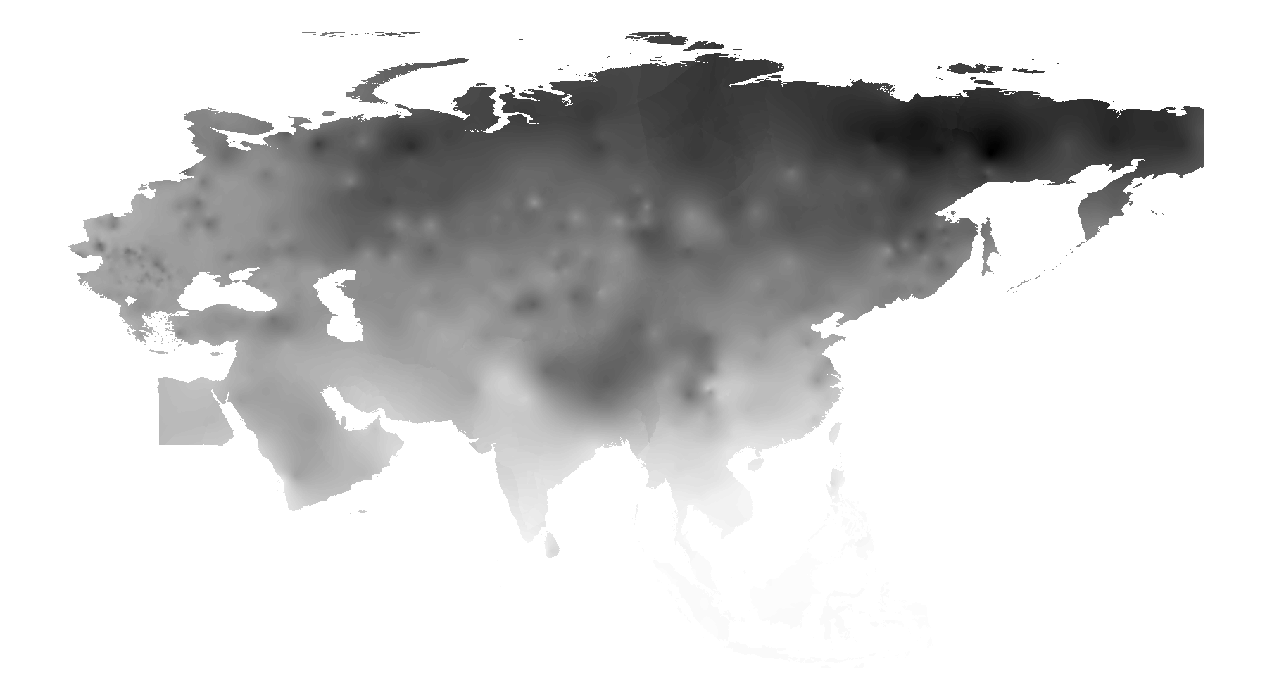
Label : The Belt and Roadaverage dew point
Date: 2020-06-04
View counts: 8990
Browse document: Browse document
Download Dataset: Log in
The data set is calculated and interpolated by weather station data. The meteorological site data comes from NOAA, which includes data such as temperature, wind speed, and precipitation. The research team processes the daily weather station data into monthly data, and then interpolates through Kriging to form raster data covering the entire study area.
Comment list ( 0 )

