Label : One Belt and One Road regionheat wave
Date: 2020-10-16
View counts: 5792
Browse document: Browse document
Download Dataset: Log in
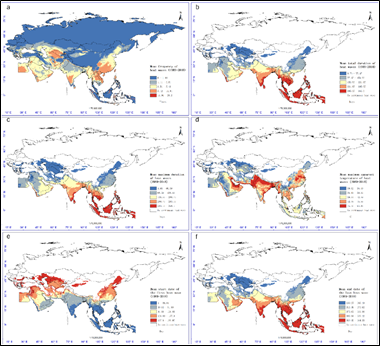
The daily apparent temperature was calculated based on the data of daily meteorological stations, and the apparent temperature raster data set of The Belt and Road region was obtained by using the interpolation method based on elevation correction, the high temperature heatwave data set of this region was calculated based on the combined heat wave threshold (CHWT) method.This data set shows the temporal and spatial distribution of high temperature heat waves in the Belt and Road region, which provides a reference and basis for users and further research.
Comment list ( 0 )

